Patriot X Posted: 16:38 Jan19 2011
Post ID: 2956191
Patriot X


Posts: 3,831
Post Likes: 0
Post Likes: 0
We started debating economics in another thread relating to a different subject.. so I decided to create a subject dedicated to the general debate of economics. I do not believe that we have something like this right now...
Anyway, I would like to start out with stating the basics of my position on the matter.
I hold the view of supply side economists such as Arthur Laffer, in the way that supply regulates demand. Also lower tax rates contribute to a more efficient and productive economy, helping to increase the wealth and standard of living of everyone.
As the debate progresses, I will elaborate on my theses.
That should be enough for a good start... so debate
Shadow_Lord Posted: 17:52 Jan20 2011
Post ID: 2956448
Shadow_Lord

Posts: 4,872
Post Likes: 0
Post Likes: 0
NOTA BENE: I am drunk whilst writing this. I apologise for any spelling and/or grammar errors that may hence occur.
"... so I decided to create a subject dedicated to the general debate of economics."
Oh good! Let's discuss the arguments of Richard C. Koo!
"I hold the view of supply side economists such as Arthur Laffer, in the way that supply regulates demand. Also lower tax rates contribute to a more efficient and productive economy, helping to increase the wealth and standard of living of everyone."
Oh alright then. We'll discuss that then if you insist.
"Supply regulates demand", eh? This on its own could mean that supply simply has an effect on demand, which I would find an entirely reasonable suggestion, although that by itself says little about the degree of that effect, and that could be debated. However, from the context of your views, I assume that you mean 'supply is the only important factor in economics and demand can practically to be ignored', to which I should respond: no, that's oversimplifying matters, and if that were so why I have a concept of demand in the first place? In (slightly) more detail: even most bona fide supply-side economists recognise that demand has at least short-term consequences even if in the long-term supply is more important. Therefore ignoring demand in the short-term can have catastrophic effects; indeed, in serious cases it can well lead to a depressionary spiral (see The Holy Grail of Macroeconomics by Richard C. Koo, as alluded to earlier). Proper application of Keynsian economics (i.e. pursuing a contractionary fiscal policy during a boom period) will render the long-term inflationary effects of an expansionary fiscal policy during a bust period (and also the accompanying fiscal deficit) moot. Ergo, simplistically speaking (and there is more to it than this, but there's no use responding to two lines with an entire essay), Keynsian economics work and should be applied. Or, at the very least, they should be applied during balance sheet recessions, where private-sector spending contracts automatically, regardless of all government policy, as a result of the desire to pay down debts; thus, public-sector spending is required to prevent the economy falling into a contractionary spiral, whereby the poor (and indeed many of the middle-class) are ruined, banks go bust and the debts to be payed off before the private sector can be a net spender again are greatly exacerbated (again, see The Holy Grail of Macroeconomics. For reference, the author, Richard C. Koo, support the Reagan administration's economics policies when they were still regarded by most of the profession as 'voodoo economics', so he's hardly a dyed-in-the-wool Keynsian).
"Also lower tax rates contribute to a more efficient and productive economy, helping to increase the wealth and standard of living of everyone."
Well, to follow that to the logical conclusion, as you've done with certain other people's posts in other threads, the optimum tax rate is 0 for everyone. However, I happen to know that you support at the very least defence spending and certain infrastructure spending, so I'll assume you mean that the optimum tax rate is whatever is just enough to pay for those. Regardless, you're wrong, because the poor benefit more from certain forms of government spending (education, say) than from the rich sitting on money in their personal savings accounts (and no, it's not invested; they don't invest it themselves because there's only so far it's wise to invest money in a business, and the banks don't invest it because nowadays they're too busy playing around with derivatives and other financial instruments). Besides, in the example of education, the private sector needs a well-educated workforce just as much as the workforce needs to be well-educated; why do you think the West is losing such ground to the likes of China and South Korea? In fact... oh wait, isn't that a supply-side reform we're talking about?
I think that's all I've got for now. Have fun, chaps. EDIT: NO WAIT I HAVE MORE!
"Anyway, I would like to start out with stating the basics of my position on the matter."
Okay, fair enough. So then you talk about supply and demand. I could go even more basic than that, but as basics go that's not too bad. But then you talk about tax rates as though they're a separate axiom. This smacks to me of very poor economics - 'lower tax rates help the economy' is not, however much you might like it to be, a self-evident truth. It needs a chain of reasoning linking it back genuinely self-evident truths - which, epistemologically speaking, should really be no more complex than 'logic works' or 'human beings should behave altruistically' - supplemented with empirical evidence. Of course, for the purposes of this debate, linking it back to statements concerning supply and demand and/or the role of government would be permissible, although I'd probably then attack those statements were I to disagree with them.
Alright. Now I'm done. For the time being.
« Last edited by Shadow_Lord on Jan 20th 2011 »
"... so I decided to create a subject dedicated to the general debate of economics."
Oh good! Let's discuss the arguments of Richard C. Koo!
"I hold the view of supply side economists such as Arthur Laffer, in the way that supply regulates demand. Also lower tax rates contribute to a more efficient and productive economy, helping to increase the wealth and standard of living of everyone."
Oh alright then. We'll discuss that then if you insist.
"Supply regulates demand", eh? This on its own could mean that supply simply has an effect on demand, which I would find an entirely reasonable suggestion, although that by itself says little about the degree of that effect, and that could be debated. However, from the context of your views, I assume that you mean 'supply is the only important factor in economics and demand can practically to be ignored', to which I should respond: no, that's oversimplifying matters, and if that were so why I have a concept of demand in the first place? In (slightly) more detail: even most bona fide supply-side economists recognise that demand has at least short-term consequences even if in the long-term supply is more important. Therefore ignoring demand in the short-term can have catastrophic effects; indeed, in serious cases it can well lead to a depressionary spiral (see The Holy Grail of Macroeconomics by Richard C. Koo, as alluded to earlier). Proper application of Keynsian economics (i.e. pursuing a contractionary fiscal policy during a boom period) will render the long-term inflationary effects of an expansionary fiscal policy during a bust period (and also the accompanying fiscal deficit) moot. Ergo, simplistically speaking (and there is more to it than this, but there's no use responding to two lines with an entire essay), Keynsian economics work and should be applied. Or, at the very least, they should be applied during balance sheet recessions, where private-sector spending contracts automatically, regardless of all government policy, as a result of the desire to pay down debts; thus, public-sector spending is required to prevent the economy falling into a contractionary spiral, whereby the poor (and indeed many of the middle-class) are ruined, banks go bust and the debts to be payed off before the private sector can be a net spender again are greatly exacerbated (again, see The Holy Grail of Macroeconomics. For reference, the author, Richard C. Koo, support the Reagan administration's economics policies when they were still regarded by most of the profession as 'voodoo economics', so he's hardly a dyed-in-the-wool Keynsian).
"Also lower tax rates contribute to a more efficient and productive economy, helping to increase the wealth and standard of living of everyone."
Well, to follow that to the logical conclusion, as you've done with certain other people's posts in other threads, the optimum tax rate is 0 for everyone. However, I happen to know that you support at the very least defence spending and certain infrastructure spending, so I'll assume you mean that the optimum tax rate is whatever is just enough to pay for those. Regardless, you're wrong, because the poor benefit more from certain forms of government spending (education, say) than from the rich sitting on money in their personal savings accounts (and no, it's not invested; they don't invest it themselves because there's only so far it's wise to invest money in a business, and the banks don't invest it because nowadays they're too busy playing around with derivatives and other financial instruments). Besides, in the example of education, the private sector needs a well-educated workforce just as much as the workforce needs to be well-educated; why do you think the West is losing such ground to the likes of China and South Korea? In fact... oh wait, isn't that a supply-side reform we're talking about?
"Anyway, I would like to start out with stating the basics of my position on the matter."
Okay, fair enough. So then you talk about supply and demand. I could go even more basic than that, but as basics go that's not too bad. But then you talk about tax rates as though they're a separate axiom. This smacks to me of very poor economics - 'lower tax rates help the economy' is not, however much you might like it to be, a self-evident truth. It needs a chain of reasoning linking it back genuinely self-evident truths - which, epistemologically speaking, should really be no more complex than 'logic works' or 'human beings should behave altruistically' - supplemented with empirical evidence. Of course, for the purposes of this debate, linking it back to statements concerning supply and demand and/or the role of government would be permissible, although I'd probably then attack those statements were I to disagree with them.
Alright. Now I'm done. For the time being.
« Last edited by Shadow_Lord on Jan 20th 2011 »
[center]
Signature credited to Nathan (or whatever he decides to call himself next)
MSN address: yamiken (at) hotmail (dot) co (dot) uk
[size=6](You know the drill, remove the spaces, replace the at with @ and the dot
Signature credited to Nathan (or whatever he decides to call himself next)
MSN address: yamiken (at) hotmail (dot) co (dot) uk
[size=6](You know the drill, remove the spaces, replace the at with @ and the dot
Patriot X Posted: 17:18 Jan21 2011
Post ID: 2956728
Patriot X
Posts: 3,831
Post Likes: 0
Post Likes: 0
Sorry for the delay, but my computer has had some issues lately. Anyway, your behemoth of a post was a nightmare to read... but I did get through it
I meant exactly what I said. The movement of supply, is what affects demand. Not the other way around. Demand is not important? Well the two go hand in hand of course...
What do you mean exactly? There is no "short term" demand changes without a change in supply. If the demand on say... banana's is high, it is due to the change in supply (a shortage). This can be either a short term effect...
Great! Now we are getting somewhere. By reading your few sentences below this post, I see that you are an advocate of spending to bail out banks, and jumpstart the economy.
First of all... do you know what happens with a private savings account? The money in it is invested... that is why it accrues interest.
Second.. yes they do invest their money into the economy directly (buying stock). I am not sure where you find your facts about investing... but I am sure that there is no one out there that keeps their money in a little tin can, hoarding it like you seem to believe.
Investing creates money... and that is simply what is happening.
I appreciate your attempt to sound intellectual, but since in your last post you said basically.... nothing, it really isn't impressive. If you agree with my reasoning... then you can say that, while if you would like to attack the foundations of my theory... go ahead. However, making a monster of a paragraph filled with words that you simply do not need to use... is not intellectual, it is merely shows that you are trying to out-word me.
super craig Posted: 18:50 Jan21 2011
Post ID: 2956752
super craig

Posts: 7,694
Post Likes: 1
Post Likes: 1
I don't believe this is strictly true, an example if you will. If I'm producing, idk, lets go with bananas and I produce them at a steadyish rate that is perfectly able to cope with the current demands but then a load of research is published that bananas definately prevent cancer for instance that is going to push the demand through the roof, outstripping my ability to supply them. You can't then say well there is purely a shortage of bananas as I'm producing them at the same rate, its is the vast demand that has created a relative shortage. It is not the supply that has created the demand but the demand that has created the supply issue.
Equally lets say the demand fell sharply if it turned out they instead caused cancer, me producing more bananas if hardly going to solve the problem. Its all very well talking of investing in stock but I've grown bananas, which aren't reknown for their ability to withstand the test of time.
I would also argue that Shadow Lord's post was certainly far from . Now I'm not sure whether you meant last paragraph as opposed to last post (implying the whole post) but if not I would certainly wager he has made several points that you have already gone on to address so how you can say it contains nothing is beyond me.
« Last edited by super craig on Jan 21st 2011 »
Let me be the first to congratulate you on witnessing pure perfection!

Shadow_Lord Posted: 20:26 Jan21 2011
Post ID: 2956800
Shadow_Lord
Posts: 4,872
Post Likes: 0
Post Likes: 0
Alright, so apparently you have something against me using big words, Patriot. I'm not sure if this is because you have a problem with them or because you genuinely do think I have a problem with them, but whatever, for you, I'll avoid big words where possible from now on. So let's take a different approach.
This is Charles:

Charles is a very rich fellow. You can tell from his top hat and monocle. His money is of course not kept in any number of tin cans or other primitive forms of storage but is instead deposited in a private savings account, where it is used by the avaricious charlatans and colossal morons commonly known as wan- sorry, bankers to create the financial equivalent of fool's gold, which they then use to trick themselves and others into thinking they've made the world rich. But that's not important right now. What's important is that Charles has a lot of money.
This is Joe:

Joe is a typical sort of guy - an average Joe, if you like. You can tell because he has no distinguishing physical features. However, Joe is an enterprising fellow, and so because it's been a good year for cod, he has bought a lot of cod from fishermen and stored it all in a big old warehouse. Now he must sell his cod or his enterprising endeavour will have turned out to be quite foolish. Fortunately, Joe happens to run into Charles. Naturally, he asks him if he wishes to buy some cod.
Now, Charles does not like cod. He is rich, so cod is not middle-class enough for him. Therefore he does not want to buy any of Joe's cod.
However, Joe calculates that Charles is unaware that it has been a good year for cod, and so supply of cod is quite high. Fortunately, Joe has a simple way of informing Charles of this development: he has a warehouse full of cod. Joe is an educated individual, so he knows that demand is entirely dependent on supply, and as such Charles' low demand for cod will rise the moment Charles realises that supply of cod is so high.
Joe therefore takes Charles to his warehouse, where he asks Charles if he still doesn't want to buy any cod.
Charles responds that he still does not.
Joe responds: "But look at all the cod that I have in my warehouse!" He opens his warehouse and shows Charles all the cod.

Charles is astounded! He had not realised that there was so much cod in the world! Suddenly his aversion to cod and lack of desire to buy it disappear entirely! All of a sudden, he must buy cod, with a desperate, burning need! He becomes...

The Crazy Cod Man!
(Note the crazy expression. And the cod.)
Crazy Cod Man cannot stop himself! The dramatically high supply of cod coupled with his own ability to buy cod has left him unable to resist buying vast, vast quantities of cod! He can't even eat as much cod as he's buying - he simply must buy cod! What hath economics wrought?!
Of course, the more astute among you will by this point have noticed that this scenario is completely and utterly ridiculous. This is because demand is not solely dependent on supply or vice versa. One can shift without the other changing (immediately, anyway). If it were otherwise, there would be no need for any concept of demand - only supply. Quantity demanded could be kept as an economic indicator, of course, but I'm sure you're all aware that quantity demanded and demand itself are not the same thing. However, there is a concept of demand, and it is relevant. Demand is related to various factors - supply is one, but so too are income levels, popular taste, inflationary expectations etc. etc.. This list goes on. And since it is self-evident that some of these are clearly to a greater or lesser degree independent of the force of supply (the example of taste being illustrated above), it therefore follows that demand too is not wholly dependent on supply. Quod erat demonstrandum, as we mathematicians and Latinists often say.
Sorry, that paragraph had a few technical terms in it again, but I have one of those irksome things called an academic qualification in economics, so it would feel silly for me not to use them. It may only have been an A-level, but it still wasn't entirely worthless, not when it comes to the basics. Besides, I thought it would be a bit insulting just to post a stickman caricature of your premise (however valid the point made by that caricature) and not even try and substantiate it with a proper narrative.
Also:
I did. I apologise for bringing epistemology - I'm one of those unbearable sorts who believes philosophy is relevant to everything - into it, but still, my basic point was that treating 'taxes should be lower' as a separate axiom rather than establishing a chain of reasoning from at least your fundamental views on supply and demand seems ludicrous and presumptuous. I didn't think the point was that obscured by my tangent on epistemology.
There's more I could say on your post, but the above suffices to address your responses, such as they were, to my main two points. Enjoy.
P.S. If you think my first post was a behemoth, you should've seen a post I did on another forum with regards to my beliefs on God recently.
« Last edited by Shadow_Lord on Jan 21st 2011 »
This is Charles:
Charles is a very rich fellow. You can tell from his top hat and monocle. His money is of course not kept in any number of tin cans or other primitive forms of storage but is instead deposited in a private savings account, where it is used by the avaricious charlatans and colossal morons commonly known as wan- sorry, bankers to create the financial equivalent of fool's gold, which they then use to trick themselves and others into thinking they've made the world rich. But that's not important right now. What's important is that Charles has a lot of money.
This is Joe:
Joe is a typical sort of guy - an average Joe, if you like. You can tell because he has no distinguishing physical features. However, Joe is an enterprising fellow, and so because it's been a good year for cod, he has bought a lot of cod from fishermen and stored it all in a big old warehouse. Now he must sell his cod or his enterprising endeavour will have turned out to be quite foolish. Fortunately, Joe happens to run into Charles. Naturally, he asks him if he wishes to buy some cod.
Now, Charles does not like cod. He is rich, so cod is not middle-class enough for him. Therefore he does not want to buy any of Joe's cod.
However, Joe calculates that Charles is unaware that it has been a good year for cod, and so supply of cod is quite high. Fortunately, Joe has a simple way of informing Charles of this development: he has a warehouse full of cod. Joe is an educated individual, so he knows that demand is entirely dependent on supply, and as such Charles' low demand for cod will rise the moment Charles realises that supply of cod is so high.
Joe therefore takes Charles to his warehouse, where he asks Charles if he still doesn't want to buy any cod.
Charles responds that he still does not.
Joe responds: "But look at all the cod that I have in my warehouse!" He opens his warehouse and shows Charles all the cod.
Charles is astounded! He had not realised that there was so much cod in the world! Suddenly his aversion to cod and lack of desire to buy it disappear entirely! All of a sudden, he must buy cod, with a desperate, burning need! He becomes...
The Crazy Cod Man!
(Note the crazy expression. And the cod.)
Crazy Cod Man cannot stop himself! The dramatically high supply of cod coupled with his own ability to buy cod has left him unable to resist buying vast, vast quantities of cod! He can't even eat as much cod as he's buying - he simply must buy cod! What hath economics wrought?!
Of course, the more astute among you will by this point have noticed that this scenario is completely and utterly ridiculous. This is because demand is not solely dependent on supply or vice versa. One can shift without the other changing (immediately, anyway). If it were otherwise, there would be no need for any concept of demand - only supply. Quantity demanded could be kept as an economic indicator, of course, but I'm sure you're all aware that quantity demanded and demand itself are not the same thing. However, there is a concept of demand, and it is relevant. Demand is related to various factors - supply is one, but so too are income levels, popular taste, inflationary expectations etc. etc.. This list goes on. And since it is self-evident that some of these are clearly to a greater or lesser degree independent of the force of supply (the example of taste being illustrated above), it therefore follows that demand too is not wholly dependent on supply. Quod erat demonstrandum, as we mathematicians and Latinists often say.
Sorry, that paragraph had a few technical terms in it again, but I have one of those irksome things called an academic qualification in economics, so it would feel silly for me not to use them. It may only have been an A-level, but it still wasn't entirely worthless, not when it comes to the basics. Besides, I thought it would be a bit insulting just to post a stickman caricature of your premise (however valid the point made by that caricature) and not even try and substantiate it with a proper narrative.
Also:
I did. I apologise for bringing epistemology - I'm one of those unbearable sorts who believes philosophy is relevant to everything - into it, but still, my basic point was that treating 'taxes should be lower' as a separate axiom rather than establishing a chain of reasoning from at least your fundamental views on supply and demand seems ludicrous and presumptuous. I didn't think the point was that obscured by my tangent on epistemology.
There's more I could say on your post, but the above suffices to address your responses, such as they were, to my main two points. Enjoy.
P.S. If you think my first post was a behemoth, you should've seen a post I did on another forum with regards to my beliefs on God recently.
« Last edited by Shadow_Lord on Jan 21st 2011 »
[center]
Signature credited to Nathan (or whatever he decides to call himself next)
MSN address: yamiken (at) hotmail (dot) co (dot) uk
[size=6](You know the drill, remove the spaces, replace the at with @ and the dot
Signature credited to Nathan (or whatever he decides to call himself next)
MSN address: yamiken (at) hotmail (dot) co (dot) uk
[size=6](You know the drill, remove the spaces, replace the at with @ and the dot
Patriot X Posted: 12:32 Jan22 2011
Post ID: 2956999
Patriot X
Posts: 3,831
Post Likes: 0
Post Likes: 0
Hmm.... point conceded. My first point overgeneralized the concept of supply regulating demand. Your analogy proved your point quite well, demand can very well move on its own due to a variety of outside factors.
Yes I did mean to say paragraph rather than post, so my apologies.
Well as much as I do like your metaphorical situation, I must say that I don't think that it quite equates to the situation I am speaking of.
If there was a high supply of cod, demand would drop, since supply affects demand inversely. You are saying that since supply was so high.... that demand would be high also. I don't believe that is the case.
Now if there were only a few cod, and the supply was low, the demand for the cod would go up. I believe that is as basic as economics go.... correct me if I am wrong

I do not blame you
Who would not flaunt an intellect and academic qualifications of that nature? 
You are correct, my premise is merely that supply is the long run is the driving factor of demand. There are outside factors.... but unless extreme they usually do not change the course of the economy.
YoSoyJu Posted: 17:12 Jan22 2011
Post ID: 2957097
YoSoyJu
Posts: 282
Post Likes: 0
Post Likes: 0
What everyone is trying to point out, John, is that you are simply naive. Supply and demand must be balanced to have a thriving economy. They don't really affect one another (this is a bit of an overgeneralization, but holds mostly true), but affect the prices of goods. Just because supply is low doesn't mean that demand will go up. I'm sure the supply for VCRs is quite low, but you don't see everyone rushing out to pick them up.
Now, what I have just said there is completely a simplification as economics are very complex, but it still holds true. If you think that supply is the only driving force behind demand or vice-versa, you are being naive.
Now, what I have just said there is completely a simplification as economics are very complex, but it still holds true. If you think that supply is the only driving force behind demand or vice-versa, you are being naive.

Catharsis Posted: 19:15 Jan22 2011
Post ID: 2957164
Catharsis
One thought fills immensity.

Posts: 3,481
Post Likes: 0
Post Likes: 0
Okay then. You're wrong.
Examine a basic demand and supply graph:
Now, we could spend all day quibbling over the elasticity of demand/supply for any given market or indeed for an economy as a whole. It's not really important for the point I'm making, though - namely that an "increase" in supply is represented by a rightwards shift of the supply curve:
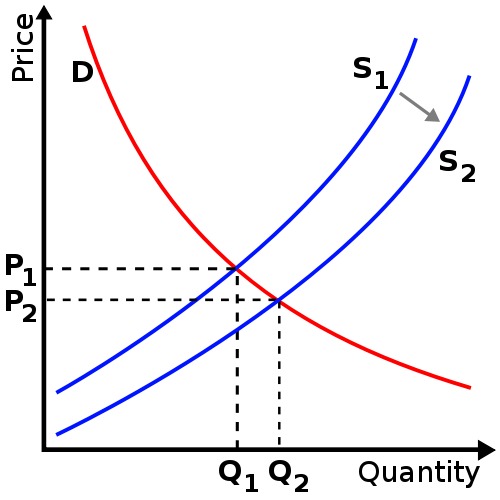
This results in both an increase in the quantity demanded, and a reduction in price.
Similarly, observe the effects of a leftwards shift of the supply curve (a "reduction" in supply):

Reduction in quantity demanded, increase in price.
Now, you seem to have the concept of demand confused with the concept of market price. This is the only explanation I can think of - quantity demanded increases when supply increases, which is the opposite of your claim that "when supply is high, demand is low". Regardless - neither quantity demanded nor the market price can be confused with the concept of demand itself, which is one of the points that economics teachers far and wide have the most trouble explaining to their classes. Demand is represented by the demand curve. It can stay at the same level when the quantity demanded changes, or when the price changes, as shown in the graphs above.
The key point, I suppose, is that while at lower levels of supply there are some people that are willing to pay more, these people were already buying at higher levels of supply when the price was lower. Their demand for the good has not increased due to the shortage. While it is true that in some cases, a reduction of supply will lead to an increase in demand (if the media whips up a frenzy over a possible fuel shortage, for instance), it cannot be declared a universal truth that the level of supply always affects demand. Indeed, as YoSoyJu has pointed out, they do not affect each other in the vast majority of cases - certainly not in the short-term.
Similarly, you seem to have a misconception that Keynesians are opposed to supply-side reforms. This is untrue - Keynesian economics made up the vast majority of what I was taught at school, and supply-side factors were almost always mentioned along with the demand-side factors. Neither supply nor demand can be focused on to the exclusion of the other if you want a sustainable economy.
So, after this session of Economics 101, have your views changed at all? Given that something you seem to regard as a basic axiom has now been fairly conclusively shown to be incorrect, I'd hope the answer to that would be yes. Unless of course, we all misinterpreted your "supply affects demand" point...
« Last edited by Catharsis on Jan 28th 2011 »

Signature and avatar made by Master Volthawk.
Email/MSN: empyrean decadence at hotmail dot com (Remove all spaces)
"Improvement makes strait roads, but the crooked roads without Improvement, are roads of Genius." - William Blake.
Winner of Member Brawl '09. Finally cleared out enough sig space to include that.
Patriot X Posted: 16:50 Jan25 2011
Post ID: 2958039
Patriot X
Posts: 3,831
Post Likes: 0
Post Likes: 0
Yes... obviously supply and demand must be balanced. I have not said anything to the effect that a abundance of supply, or abundance of demand is a good thing. Equilibrium is of course what the market strives for.
However, I must disagree when you say that supply and demand do not affect one another. I would say that it merely takes common sense to see... that if more people want a certain product, the price of that product will be higher.
Your VCR point is a good one. There are many factors that affect supply and demand...
Yes, I have learned quite a few things about supply/demand/market price. Thank you for your explanation
While I have been mistaken on a lot of this, my real point in creating this topic was to debate more on economic policies such as taxation, and such. While I did not get off to a good start... I would like to continue this.
nightmare2 Posted: 20:48 Jan25 2011
Post ID: 2958099
nightmare2
Lord of Nightmares

Posts: 3,482
Post Likes: 41
Post Likes: 41
Alright so I read about 90 percent of the posts here. I skipped over parts that made my head hurt. But I am confused a bit to what demand means in economics. So I guess I will just give an example of what I have so far read and figured out myself what demand means.
The supply for bananas drops dramatically, so people want bananas more, therefore the demand goes up. Prices shoot upward.
Simple... too lazy to elaborate more on that. But demand means people want something more. So your saying they don't effect eachother? Well supply directly effects the prices of a certain object. If the supply of bananas was low then the price would be high. While if it was high then the price would drop. If the price rose then demand would drop and vice versa. But niether price or demand would effect the supply because it can't magically respond to increase or decrease in its demand/price. Supply effects marketing price which effects general demand or want for item.
Prices of goods would directly affect the demand unless another factor was at play, such as bananas prevent or cause cancer as said above. So Supply indirectly affects demand. On the other hand Supply is the amount of an item. Supply cannot be effected by demand or price because one can't control how much of something is produced.
Banana example again. The production rate dropped do to X happening (switch out X for banana related disaster).
Completely unrelated to anything above, except maybe prices. One word. Which i am positive relates to economics, though correct me if I'm wrong.
Inflation
^The one word.
« Last edited by nightmare2 on Jan 25th 2011 »
Sir Adam of Peridot Nightmares
Go visit the Fan Fiction and Role Playing Forum and check out what is there maybe you will see something of interest and feel free to stay and have a cup of -insert beverage of choice here- and some cookies. It's on the house! Well it would be if I had a house...
Go visit the Fan Fiction and Role Playing Forum and check out what is there maybe you will see something of interest and feel free to stay and have a cup of -insert beverage of choice here- and some cookies. It's on the house! Well it would be if I had a house...
YoSoyJu Posted: 18:54 Jan26 2011
Post ID: 2958323
YoSoyJu
Posts: 282
Post Likes: 0
Post Likes: 0
But that is market price, not supply. nightmare, you make the same confusion. Market price is not the same as supply. Also, your example is about demand being the determining factor when your whole thesis was that supply was the main controller of market forces. You are contradicting yourself.
And nightmare, what are you saying about inflation?
Catharsis Posted: 20:00 Jan26 2011
Post ID: 2958335
Catharsis
One thought fills immensity.
Posts: 3,481
Post Likes: 0
Post Likes: 0
There seems to be a lot of confusion as to what the concepts of demand/supply in economics actually represent, so before we move on to discussing more complex points such as fiscal and monetary policy, I think it would be helpful to clear up these notions to avoid confusion at a later point when both sides are using the same terms to mean different things.
[b][u]Demand[/b][/u]
Now, as I mentioned in my last post, demand is represented by the demand curve, as in the above graphs. However, perhaps this explanation alone is not self-evident enough to convey what exactly demand is. So I'll provide you with the very same explanation that my economics teacher gave in my first class, which involves providing a simplified example and drawing a demand curve for it.
Suppose you come across a man selling ice cream. At the price at which he currently offers, you decide that it's not worth your money to buy an ice cream. This is the point corresponding to 1 on the graph, where quantity is zero and the price is high. However, you come back a little later and he's realised that he's not selling very much ice cream, so he's cut his prices a little. You now decide that it is worth buying an ice cream, at the point corresponding to 2 on the graph. Finally, you come back again at the end of the day and discover that the man's freezer has broken. He's thus giving away all his remaining ice cream for free. Now, even if he had an infinite stock of ice cream, would you take it all? Of course not, you have no need for that much ice cream and most of it would melt before you took it home. But you'd take maybe five or six, and beyond that point you have no desire for ice cream. Point 3 on the graph.

So, that's a rough lesson in how to read the demand curve, at least. But I still haven't really explained how demand is represented by the demand curve and not by quantity demanded. Well, fortunately now that you can read demand curves, I can simply draw you another demand curve, again for ice cream, but on a hotter day.

Because it's hotter, you might well buy ice cream at the price you decided was too high the previous day. And if the man's freezer were to break again, you'd take home more ice cream. Your demand for it has increased.
To put it in technical terms - demand is a representation of how much people are willing to buy at certain prices. Obviously, demand curves for entire markets or entire economies are more complex than an individual's demand curve such as the one I drew previously. But the example of the individual helps to demonstrate that changes in demand are more complex than just "people want things more if they're paying more for them". Neither the amount that people buy or the price they pay for it are expressions of demand itself.
I -think- that's everything, but do please ask if there's something I haven't made clear. Now, onto supply.
Supply
Well, supply's essentially the complement to demand - how much people are willing to supply at certain prices. It's thus represented on the same graph, but with an opposite slope:

Again, this is easy enough to understand. At higher prices, it's more attractive for suppliers to provide increased quantities of certain goods. I could, again, do an example of an individual's supply curve, but I feel that this would be labouring the point. If you would like such an explanation then let me know, but until then I'm going to assume it's unnecessary and move on to the main point.
[b][u]How Demand and Supply actually relate to each other[/b][/u]
As I mentioned when discussing supply, demand and supply are plotted on the same graph.

I have marked on the graph the point at which they meet on both the Price and Quantity axes. This point is known as equilibrium. It's the point at which demand and supply match each other - i.e. at the price shown, suppliers are willing to supply the exact amount that people will buy. At any other point on the graph, one will outstrip another - at higher prices, people aren't buying all that's being supplied and at the lower prices suppliers aren't providing the amount that people want.
Now, if one curve shifts (i.e. moves), as in the example of a hotter day increasing the demand for ice cream, above, then the equilibrium point will change. This is all that happens. If one curve shifts the other does not automatically shift to compensate. This is what we mean when we say supply does not affect demand and vice versa. Changes in either will change the quantity and price of a good, in different ways depending on what shifts and which way it shifts. I illustrated some of these shifts in my last post.
The key point, though, is that you have to stop thinking of price as being the controller of either demand or supply, as artificially modified prices will result in either shortages or surpluses in the short term. Companies may cut back on supply to increase prices, but that's supply affecting the price, not price affecting the supply. Generally, it is supply and demand that determine the price of a good and the quantity of a good provided.
I do hope that's cleared things up for those that haven't formally studied economics, because it took me quite a while to type all of this out and draw the graphs in Paint. Heh. So if you have any questions, please ask me, or if you understand then please make that clear so that we can move beyond the basics of economics and into the fiscal/monetary policies that I imagine everyone is more keen to discuss.
Signature and avatar made by Master Volthawk.
Email/MSN: empyrean decadence at hotmail dot com (Remove all spaces)
"Improvement makes strait roads, but the crooked roads without Improvement, are roads of Genius." - William Blake.
Winner of Member Brawl '09. Finally cleared out enough sig space to include that.
[b][u]Demand[/b][/u]
Now, as I mentioned in my last post, demand is represented by the demand curve, as in the above graphs. However, perhaps this explanation alone is not self-evident enough to convey what exactly demand is. So I'll provide you with the very same explanation that my economics teacher gave in my first class, which involves providing a simplified example and drawing a demand curve for it.
Suppose you come across a man selling ice cream. At the price at which he currently offers, you decide that it's not worth your money to buy an ice cream. This is the point corresponding to 1 on the graph, where quantity is zero and the price is high. However, you come back a little later and he's realised that he's not selling very much ice cream, so he's cut his prices a little. You now decide that it is worth buying an ice cream, at the point corresponding to 2 on the graph. Finally, you come back again at the end of the day and discover that the man's freezer has broken. He's thus giving away all his remaining ice cream for free. Now, even if he had an infinite stock of ice cream, would you take it all? Of course not, you have no need for that much ice cream and most of it would melt before you took it home. But you'd take maybe five or six, and beyond that point you have no desire for ice cream. Point 3 on the graph.
So, that's a rough lesson in how to read the demand curve, at least. But I still haven't really explained how demand is represented by the demand curve and not by quantity demanded. Well, fortunately now that you can read demand curves, I can simply draw you another demand curve, again for ice cream, but on a hotter day.
Because it's hotter, you might well buy ice cream at the price you decided was too high the previous day. And if the man's freezer were to break again, you'd take home more ice cream. Your demand for it has increased.
To put it in technical terms - demand is a representation of how much people are willing to buy at certain prices. Obviously, demand curves for entire markets or entire economies are more complex than an individual's demand curve such as the one I drew previously. But the example of the individual helps to demonstrate that changes in demand are more complex than just "people want things more if they're paying more for them". Neither the amount that people buy or the price they pay for it are expressions of demand itself.
I -think- that's everything, but do please ask if there's something I haven't made clear. Now, onto supply.
Supply
Well, supply's essentially the complement to demand - how much people are willing to supply at certain prices. It's thus represented on the same graph, but with an opposite slope:
Again, this is easy enough to understand. At higher prices, it's more attractive for suppliers to provide increased quantities of certain goods. I could, again, do an example of an individual's supply curve, but I feel that this would be labouring the point. If you would like such an explanation then let me know, but until then I'm going to assume it's unnecessary and move on to the main point.
[b][u]How Demand and Supply actually relate to each other[/b][/u]
As I mentioned when discussing supply, demand and supply are plotted on the same graph.
I have marked on the graph the point at which they meet on both the Price and Quantity axes. This point is known as equilibrium. It's the point at which demand and supply match each other - i.e. at the price shown, suppliers are willing to supply the exact amount that people will buy. At any other point on the graph, one will outstrip another - at higher prices, people aren't buying all that's being supplied and at the lower prices suppliers aren't providing the amount that people want.
Now, if one curve shifts (i.e. moves), as in the example of a hotter day increasing the demand for ice cream, above, then the equilibrium point will change. This is all that happens. If one curve shifts the other does not automatically shift to compensate. This is what we mean when we say supply does not affect demand and vice versa. Changes in either will change the quantity and price of a good, in different ways depending on what shifts and which way it shifts. I illustrated some of these shifts in my last post.
The key point, though, is that you have to stop thinking of price as being the controller of either demand or supply, as artificially modified prices will result in either shortages or surpluses in the short term. Companies may cut back on supply to increase prices, but that's supply affecting the price, not price affecting the supply. Generally, it is supply and demand that determine the price of a good and the quantity of a good provided.
I do hope that's cleared things up for those that haven't formally studied economics, because it took me quite a while to type all of this out and draw the graphs in Paint. Heh. So if you have any questions, please ask me, or if you understand then please make that clear so that we can move beyond the basics of economics and into the fiscal/monetary policies that I imagine everyone is more keen to discuss.
Signature and avatar made by Master Volthawk.
Email/MSN: empyrean decadence at hotmail dot com (Remove all spaces)
"Improvement makes strait roads, but the crooked roads without Improvement, are roads of Genius." - William Blake.
Winner of Member Brawl '09. Finally cleared out enough sig space to include that.
nightmare2 Posted: 21:42 Jan26 2011
Post ID: 2958376
nightmare2
Lord of Nightmares
Posts: 3,482
Post Likes: 41
Post Likes: 41
Thanks alot Cartharis, that helped tons. Those graphs were so much easier to read and understand compared to your previous ones.
Well over the past couple decades the cost of goods has raised greatly due to the great decline of the worth of money.
Inflation at work here.
Now printing more money does nothing but contribute to the problem.
Why not just burn, recycle into paper, rid ourselves of some money? Obviously it wouldn't be so simple. One can't just randomly rid themselves of millions of dollars. Deflation would require alot of calculations to work, but why haven't anyone tried this before? Even in small scale. Raising the worth of money could help the lower and middle classes alot.
Your answer to the question you directed towards me YoSoyJu.
***
Well over the past couple decades the cost of goods has raised greatly due to the great decline of the worth of money.
Inflation at work here.
Now printing more money does nothing but contribute to the problem.
Why not just burn, recycle into paper, rid ourselves of some money? Obviously it wouldn't be so simple. One can't just randomly rid themselves of millions of dollars. Deflation would require alot of calculations to work, but why haven't anyone tried this before? Even in small scale. Raising the worth of money could help the lower and middle classes alot.
Your answer to the question you directed towards me YoSoyJu.
Sir Adam of Peridot Nightmares
Go visit the Fan Fiction and Role Playing Forum and check out what is there maybe you will see something of interest and feel free to stay and have a cup of -insert beverage of choice here- and some cookies. It's on the house! Well it would be if I had a house...
Go visit the Fan Fiction and Role Playing Forum and check out what is there maybe you will see something of interest and feel free to stay and have a cup of -insert beverage of choice here- and some cookies. It's on the house! Well it would be if I had a house...
YoSoyJu Posted: 22:08 Jan26 2011
Post ID: 2958383
YoSoyJu
Posts: 282
Post Likes: 0
Post Likes: 0
Though the value of the dollar does generally go down with an influx of cash into the system, the opposite isn't really true. How can you get rid of cash in the system? All the cash in the system belongs to some entity.
But inflation isn't really the problem right now. We need to get our GDP per capita up and create new jobs (which kind of go hand in hand).
But inflation isn't really the problem right now. We need to get our GDP per capita up and create new jobs (which kind of go hand in hand).
Catharsis Posted: 16:57 Jan28 2011
Post ID: 2958960
Catharsis
One thought fills immensity.
Posts: 3,481
Post Likes: 0
Post Likes: 0
More importantly, deflation is fairly universally viewed among economists as being a bad thing. Remember - inflation isn't to do with the value of money, in a purely technical sense, but the general price level. If inflation is high then prices are rising quickly, if the economy is undergoing deflation then prices are falling.
But if prices are constantly falling, then where's the incentive for anyone to buy anything? Why not wait until the price has fallen down further? It just leads to a downwards spiral - people don't buy because they're waiting for prices to fall further, which means that sellers cut their prices, which means that people go on waiting... This is aggravated by the fact that deflation tends to happen during recessions, when people are generally more careful with their money.
High inflation is also a bad thing (see: Weimar Germany, Zimbabwe et al.) but low inflation tends to be what governments aim for. I know the Bank of England's inflation target is 2 percent, although they have to balance controlling inflation with stimulating the economy through monetary policy and other such concerns, particularly at present.
« Last edited by Catharsis on Jan 28th 2011 »
Signature and avatar made by Master Volthawk.
Email/MSN: empyrean decadence at hotmail dot com (Remove all spaces)
"Improvement makes strait roads, but the crooked roads without Improvement, are roads of Genius." - William Blake.
Winner of Member Brawl '09. Finally cleared out enough sig space to include that.
nightmare2 Posted: 20:44 Jan28 2011
Post ID: 2959037
nightmare2
Lord of Nightmares
Posts: 3,482
Post Likes: 41
Post Likes: 41
Slowly and all stealthily like the government takes a small amount of money from all the wealthy people's pay checks until they have a balanced amount of money.
In large amounts yes that is true, but if we slowly raise the worth of the American Dollor or European Euro or whatever Germany currently uses then it can temporarily encourage people to spend more. Which is what we currently (in America) want. We want money to be put into the system. The more dollar bills or euros present in the system generally decreases their worth. People who have alot more money, upper class, are what we really want to encourage to spend money. Most are just keeping their money in banks.
Then we work on opening up more jobs to keep the new money in the system from returning to the rich.
But yes anything in big amounts is bad. A small push this way or that is what we should do. See how it works and then move on accordingly. I don't see why we don't try it, theoretically it might not work but theory isn't always right. And you won't know unless you try but staying on the smaller push is best.
Creating Jobs is important, but how would we really do that? After researching abit I got a couple things.
Extend Bush Tax Cuts
Widen the TARP
Boost Unemployment Benefits Why? Wouldn't this just discourage people from looking?
Create more Wind Farms
Increase trade between Countries.
Sir Adam of Peridot Nightmares
Go visit the Fan Fiction and Role Playing Forum and check out what is there maybe you will see something of interest and feel free to stay and have a cup of -insert beverage of choice here- and some cookies. It's on the house! Well it would be if I had a house...
Go visit the Fan Fiction and Role Playing Forum and check out what is there maybe you will see something of interest and feel free to stay and have a cup of -insert beverage of choice here- and some cookies. It's on the house! Well it would be if I had a house...
Catharsis Posted: 01:14 Jan29 2011
Post ID: 2959105
Catharsis
One thought fills immensity.
Posts: 3,481
Post Likes: 0
Post Likes: 0
Well, no, inflation isn't as simple as just how much money is supplied by the central bank in a given year, although monetarists would have you believe that, of course. It doesn't matter how much money you put into the economy if people aren't spending it and thus it isn't circulating. Remember, inflation is about the price level, not merely the amount of money theoretically present in an economy. It's also affected by things like commodity prices (oil, raw materials and other such things) as they have a knock-on effect on aggregate supply, as do exchange rates (if your currency appreciates relative to another currency then inflation tends to fall, and vice versa).
But you're effectively contradicting yourself anyway - you first said that deflation would encourage people to spend, to which I responded that the general effect of deflation on spending is to reduce it, to which you then respond that if it was done slowly then this would somehow encourage people to spend more. Surely, if it's happening at such a slow rate that people are unaware of the falling prices (thus preventing the effect I described from happening) then they're equally unlikely to increase their spending as a result of it?
And it's true that theory isn't always right, but it's better to attempt things that theory suggests are helpful than to throw theory out of the window entirely and try absolutely anything. Wouldn't you agree? If "theory isn't always right" was an adequate justification for attempting something then we could, say... impose a rule that only allowed businesses to operate on Mondays, with the same justification. Obviously, this would be terrible for the economy - and theory predicts this! Better to base economic judgements on theory, and then modify them if they're not working, rather than to discard theory and try anything.
Now, would you like to discuss any of the ideas you found, particularly? You've not stated whether you believe any of them would work or not, with the exception of increasing unemployment benefits... I shall respond to your question on that point, at any rate. Yes, unemployment benefit increases could potentially discourage people from looking for jobs if ever it became the case that being on benefits earned you more money than working. However, if this is not the case, then yes - increasing unemployment benefits can create jobs by stimulating demand within the economy. This is a pragmatic solution, particularly when there are more people out of employment than there are jobs available - which is why some people's "solution" to unemployment of slashing benefits is impractical and unjustified - the unemployed are still not instantly able to find jobs because there simply aren't enough available, and they have less discretionary income and thus can't spend as much, reducing demand within the economy and therefore reducing the rate at which jobs are created.
Signature and avatar made by Master Volthawk.
Email/MSN: empyrean decadence at hotmail dot com (Remove all spaces)
"Improvement makes strait roads, but the crooked roads without Improvement, are roads of Genius." - William Blake.
Winner of Member Brawl '09. Finally cleared out enough sig space to include that.
Currently viewing this thread:
REPLY IN THIS THREAD
Users under 13 are not eligible to post on the SuperCheats forums.
